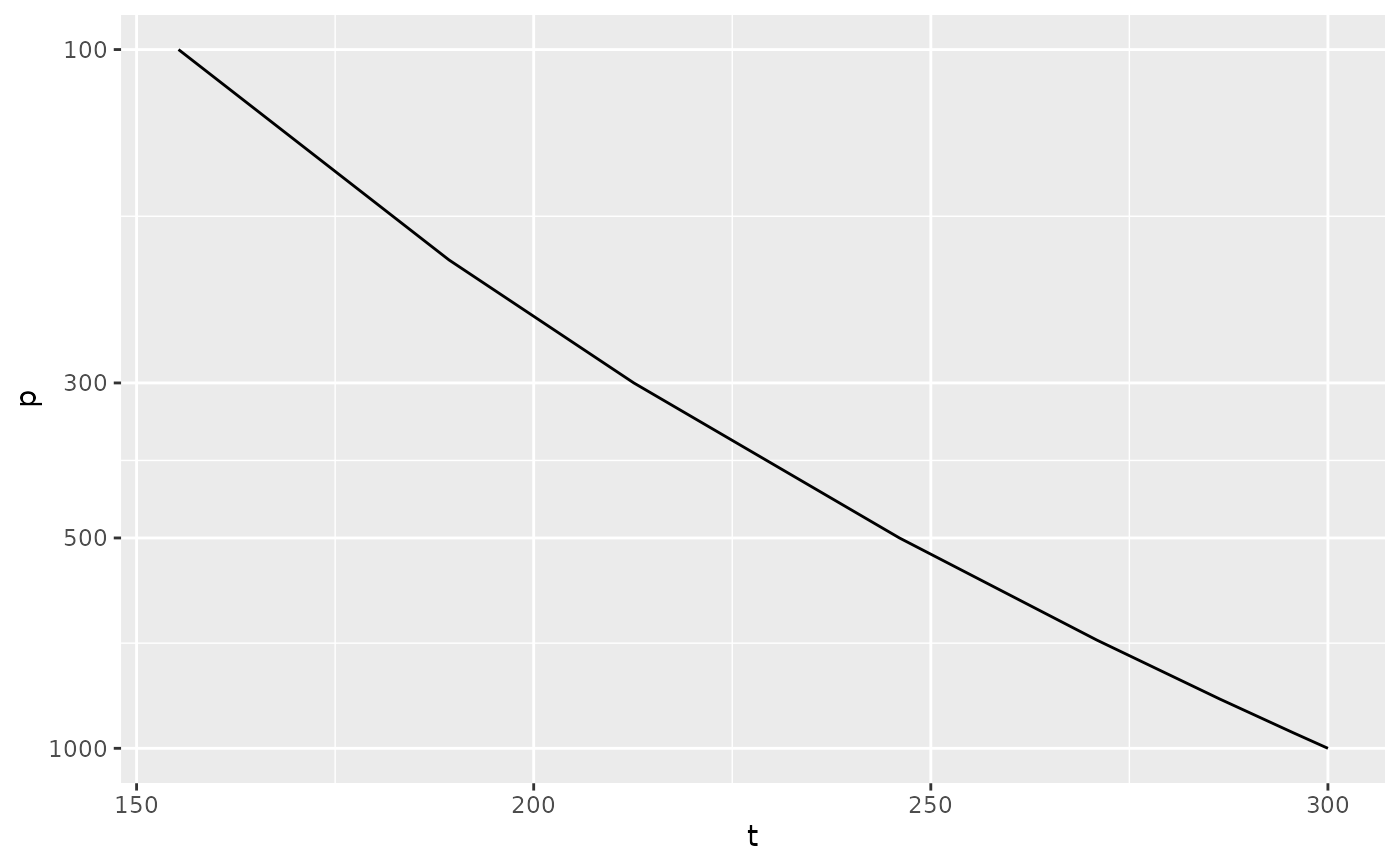
Reverse log transformation. Useful when plotting and one axis is in pressure levels.
Examples
# Adiabatic temperature profile
gamma <- 0.286
t <- data.frame(p = c(1000, 950, 850, 700, 500, 300, 200, 100))
t$t <- 300*(t$p/1000)^gamma

library(ggplot2)
ggplot(t, aes(p, t)) +
   geom_line() +
   coord_flip() +
   scale_x_continuous(trans = "reverselog")