Functions that return functions suitable to use as the breaks argument in
ggplot2's continuous scales and in geom_contour_fill.
Modifies a breaks function to compute breaks using a trimmed range of the data to avoid extreme outliers stretching the scale.
Usage
MakeBreaks(binwidth = NULL, bins = 10, exclude = NULL)

AnchorBreaks(anchor = 0, binwidth = NULL, exclude = NULL, bins = 10)

robust_breaks(breaks = MakeBreaks(), quantiles = c(0.02, 0.98))
Arguments
- binwidth
width of breaks
- bins
number of bins, used if
binwidth = NULL- exclude
a vector of breaks to exclude
- anchor
anchor value
- breaks
A function that takes the range of the data and binwidth as input and returns the the breaks as output.
- quantiles
Numeric vector of length 2, sorted in ascending order, with values between 0 and 1 representing the quantiles of
zthat define the range used to compute breaks.
Value
A function that takes a range as argument and a binwidth as an optional argument
and returns a sequence of equally spaced intervals covering the range.
For robust_breaks, a function to use as breaks argument in contour geoms.
It takes a data frame containing a column z, binwidth and bin
arguments and returns a numeric vector of breaks, possibly including
-Inf and Inf.
Details
MakeBreaks is essentially an export of the default way
ggplot2::stat_contour makes breaks.
AnchorBreaks makes breaks starting from an anchor value and covering
the range of the data according to binwidth.
Examples
my_breaks <- MakeBreaks(10)
my_breaks(c(1, 100))
#> [1] 0 10 20 30 40 50 60 70 80 90 100
my_breaks(c(1, 100), 20) # optional new binwidth argument ignored
#> [1] 0 10 20 30 40 50 60 70 80 90 100
MakeBreaks()(c(1, 100), 20) # but is not ignored if initial binwidth is NULL
#> [1] 0 20 40 60 80 100
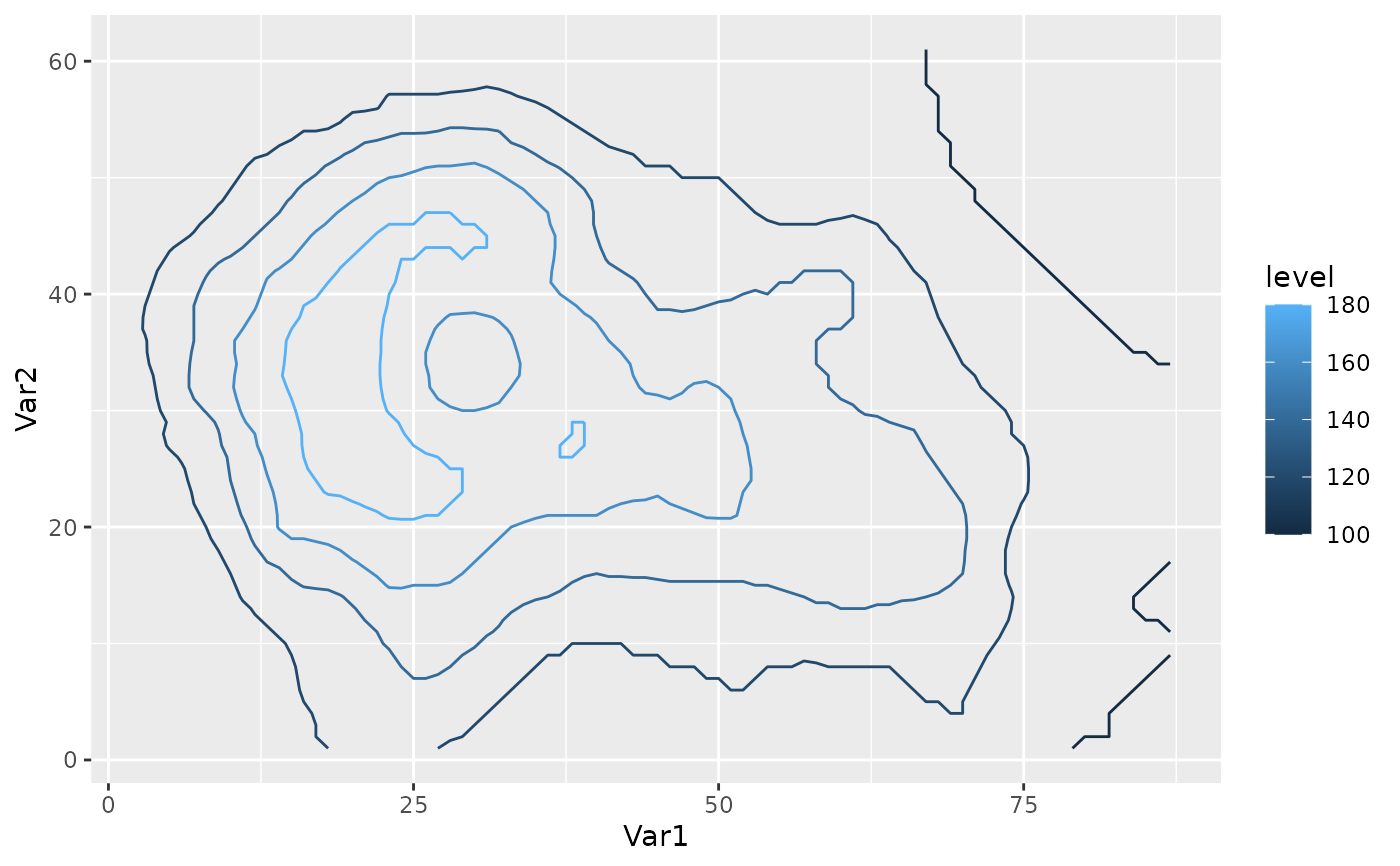
# One to one mapping between contours and breaks
library(ggplot2)
binwidth <- 20
ggplot(reshape2::melt(volcano), aes(Var1, Var2, z = value)) +
geom_contour(aes(color = after_stat(level)), binwidth = binwidth) +
scale_color_continuous(breaks = MakeBreaks(binwidth))
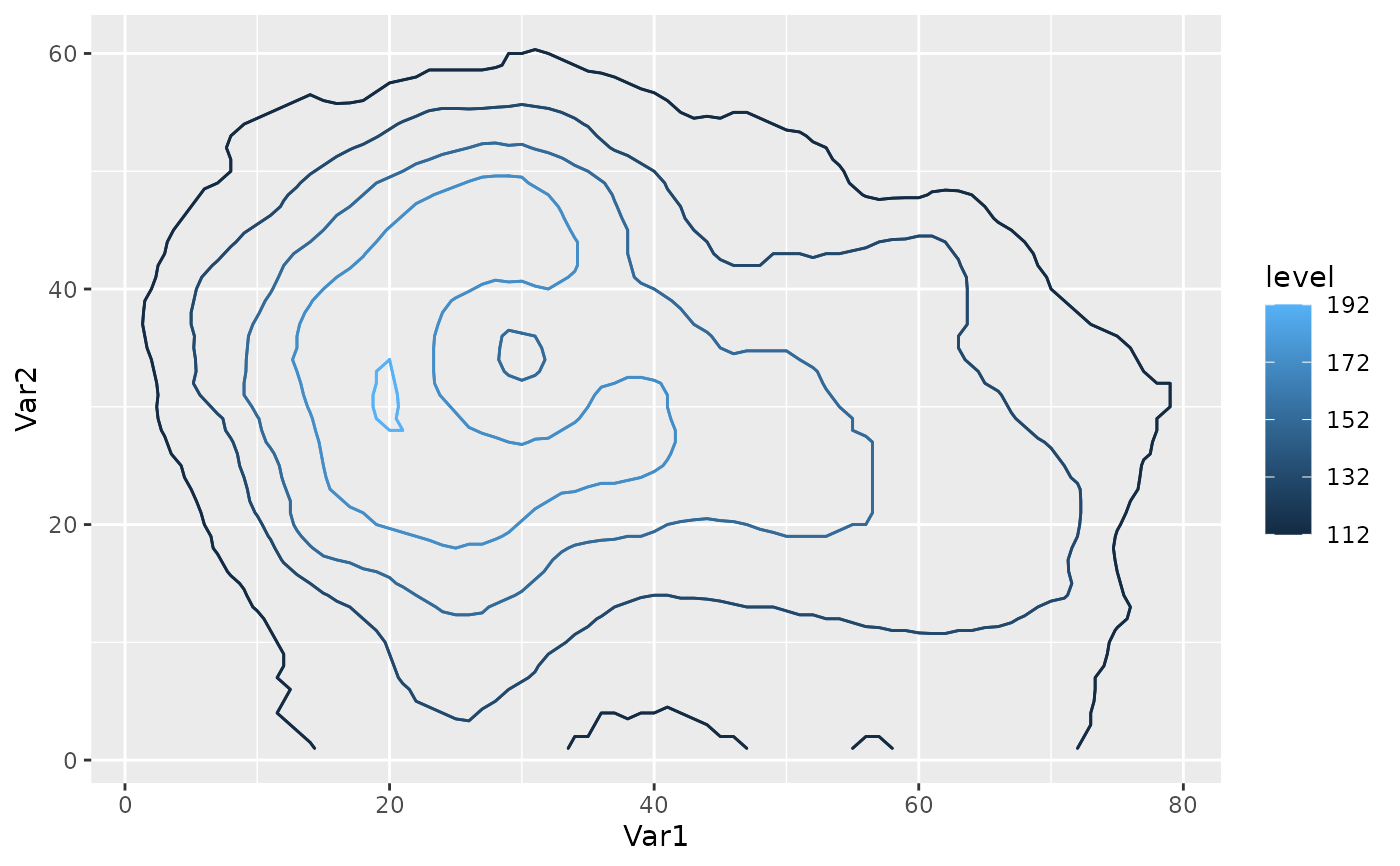
 #Two ways of getting the same contours. Better use the second one.
ggplot(reshape2::melt(volcano), aes(Var1, Var2, z = value)) +
geom_contour2(aes(color = after_stat(level)), breaks = AnchorBreaks(132),
binwidth = binwidth) +
geom_contour2(aes(color = after_stat(level)), breaks = AnchorBreaks(132, binwidth)) +
scale_color_continuous(breaks = AnchorBreaks(132, binwidth))
#Two ways of getting the same contours. Better use the second one.
ggplot(reshape2::melt(volcano), aes(Var1, Var2, z = value)) +
geom_contour2(aes(color = after_stat(level)), breaks = AnchorBreaks(132),
binwidth = binwidth) +
geom_contour2(aes(color = after_stat(level)), breaks = AnchorBreaks(132, binwidth)) +
scale_color_continuous(breaks = AnchorBreaks(132, binwidth))
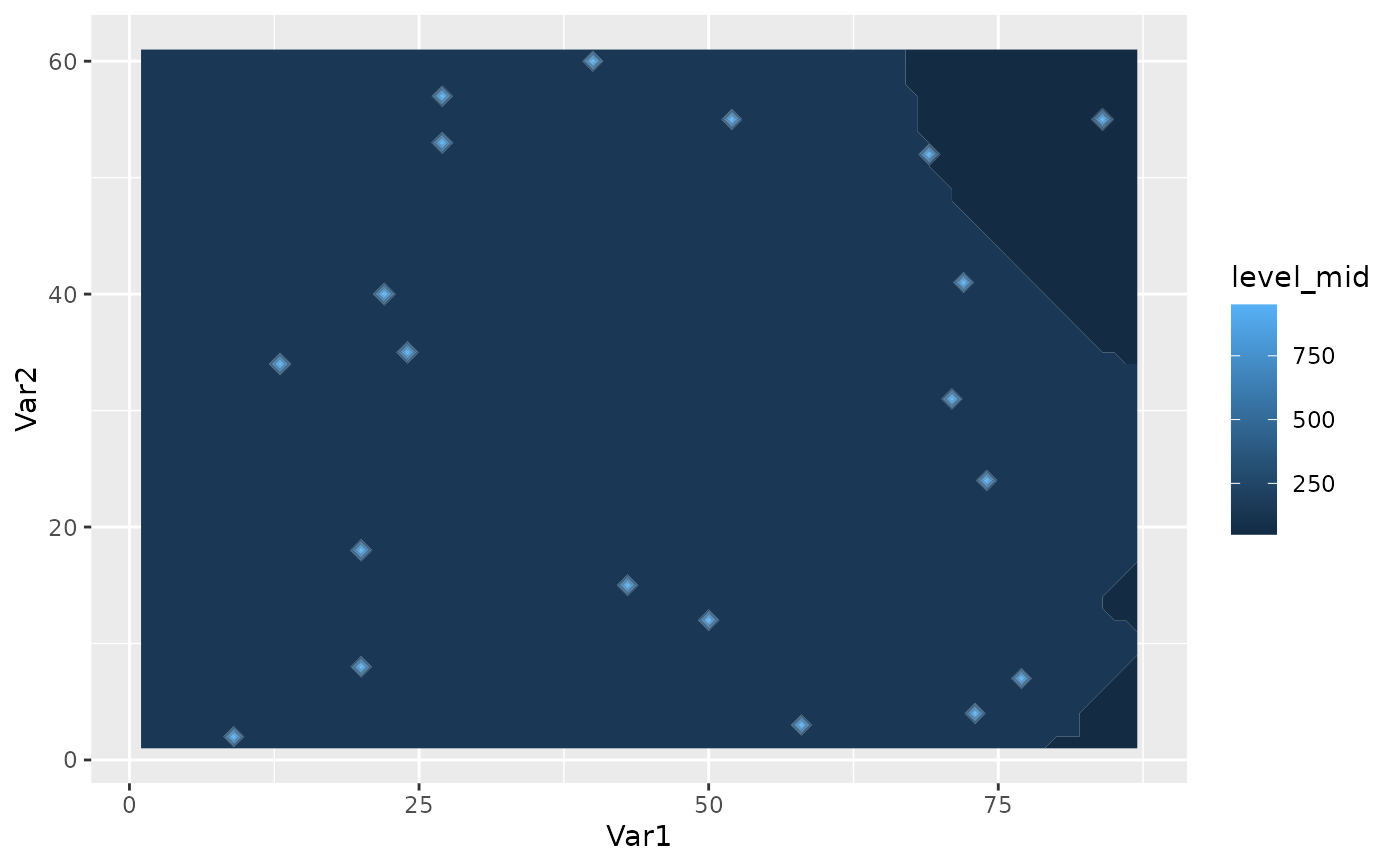
 # Sample data with extremes
surface <- reshape2::melt(volcano)
surface$value[sample(nrow(surface), 20)] <- 1000
# With regular breaks the outliers stretch the scale
# and prevent seeing the variability of the bulk of the data
ggplot(surface, aes(Var1, Var2, z = value)) +
geom_contour_fill()
# Sample data with extremes
surface <- reshape2::melt(volcano)
surface$value[sample(nrow(surface), 20)] <- 1000
# With regular breaks the outliers stretch the scale
# and prevent seeing the variability of the bulk of the data
ggplot(surface, aes(Var1, Var2, z = value)) +
geom_contour_fill()
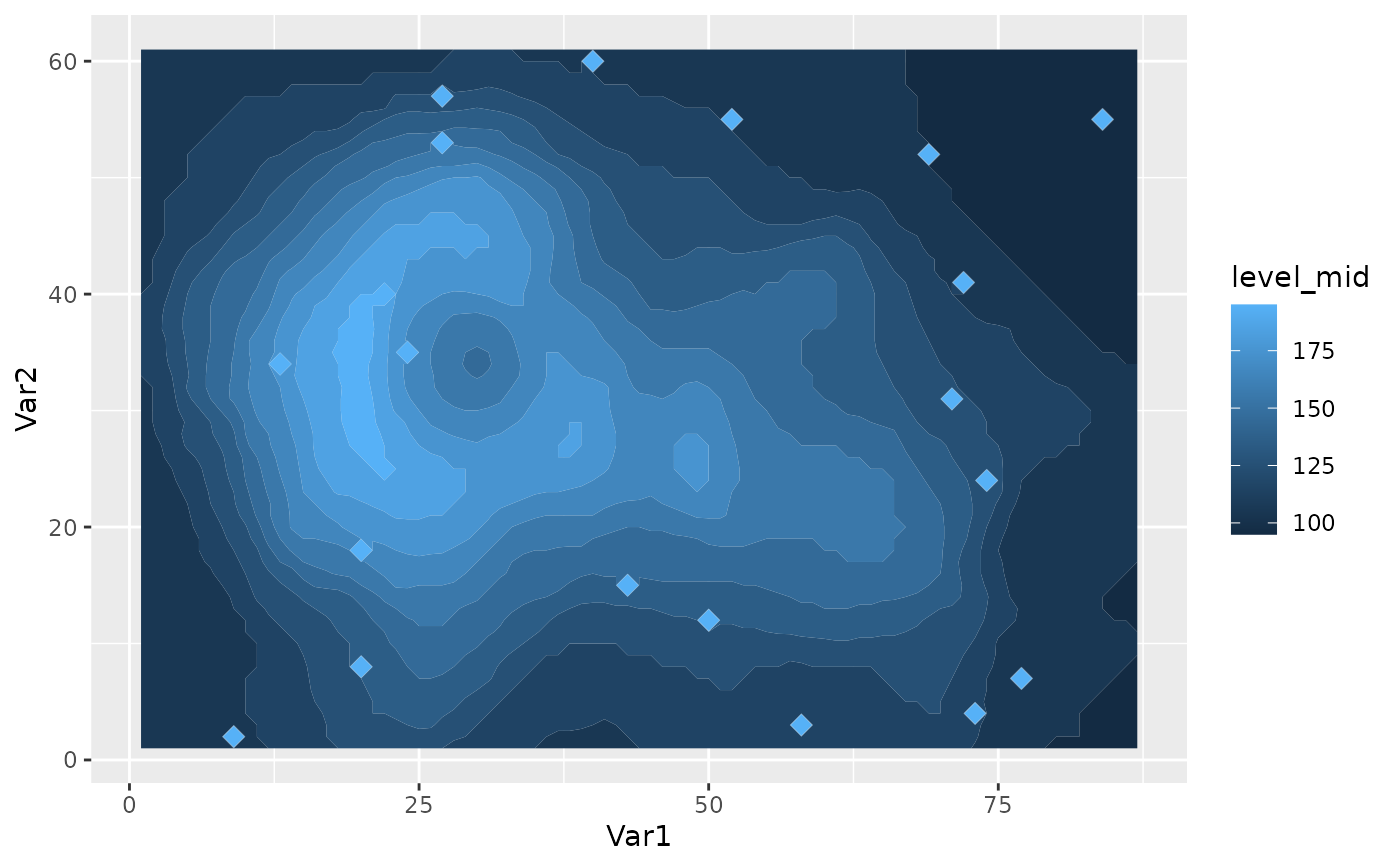
 # Robust breaks removes those points from the break
# computation and allow to see the variability
ggplot(surface, aes(Var1, Var2, z = value)) +
geom_contour_fill(breaks = robust_breaks())
# Robust breaks removes those points from the break
# computation and allow to see the variability
ggplot(surface, aes(Var1, Var2, z = value)) +
geom_contour_fill(breaks = robust_breaks())