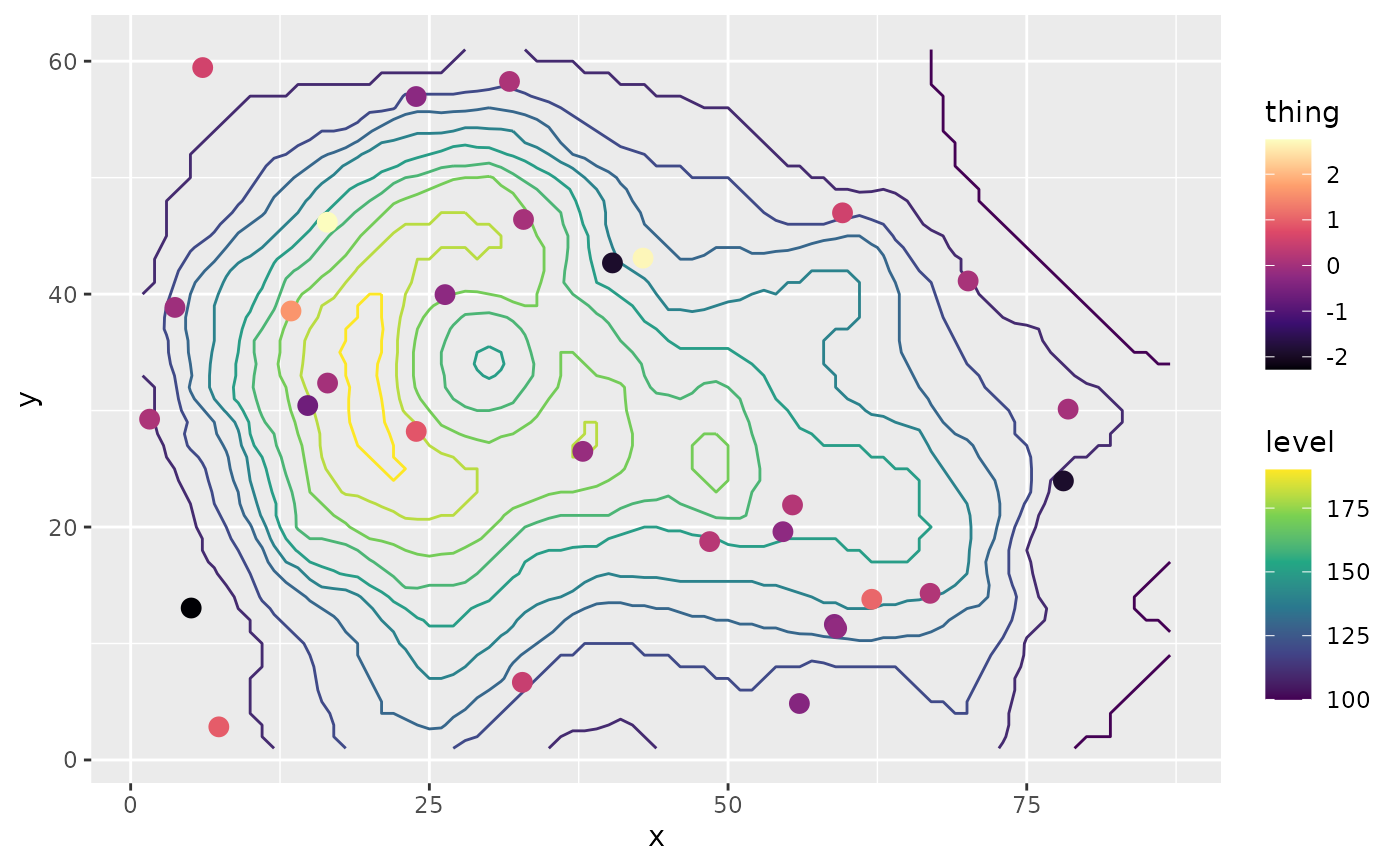
Creates a new scale "slot". Geoms added to a plot after this function will use a new scale definition.
Details
new_scale_color(), new_scale_colour() and new_scale_fill() are just
aliases to new_scale("color"), etc...
Examples
library(ggplot2)

# Equivalent to melt(volcano), but we don't want to depend on reshape2
topography <- expand.grid(x = 1:nrow(volcano),
                          y = 1:ncol(volcano))
topography$z <- c(volcano)

# point measurements of something at a few locations
measurements <- data.frame(x = runif(30, 1, 80),
                           y = runif(30, 1, 60),
                           thing = rnorm(30))

ggplot(mapping = aes(x, y)) +
  geom_contour(data = topography, aes(z = z, color = stat(level))) +
  # Color scale for topography
  scale_color_viridis_c(option = "D") +
  # geoms below will use another color scale
  new_scale_color() +
  geom_point(data = measurements, size = 3, aes(color = thing)) +
  # Color scale applied to geoms added after new_scale_color()
  scale_color_viridis_c(option = "A")
#> Warning: `stat(level)` was deprecated in ggplot2 3.4.0.
#> ℹ Please use `after_stat(level)` instead.

