Create discretised versions of continuous scales
Source:R/as-discretised-scale.R, R/scale-unbinned.R
discretised_scale.RdThis scale allows ggplot to understand data that has been discretised with
some procedure akin to cut and access the underlying continuous values.
For a scale that does the opposite (take continuous data and treat them as
discrete) see ggplot2::binned_scale().
Usage
as.discretised_scale(scale_function)

scale_fill_discretised(
  ...,
  low = "#132B43",
  high = "#56B1F7",
  space = "Lab",
  na.value = "grey50",
  guide = ggplot2::guide_colorsteps(even.steps = FALSE, show.limits = TRUE),
  aesthetics = "fill"
)

scale_fill_divergent_discretised(
  ...,
  low = scales::muted("blue"),
  mid = "white",
  high = scales::muted("red"),
  midpoint = 0,
  space = "Lab",
  na.value = "grey50",
  guide = ggplot2::guide_colorsteps(even.steps = FALSE, show.limits = TRUE)
)

discretised_scale(
  aesthetics,
  scale_name,
  palette,
  name = ggplot2::waiver(),
  breaks = ggplot2::waiver(),
  labels = ggplot2::waiver(),
  limits = NULL,
  trans = scales::identity_trans(),
  na.value = NA,
  drop = FALSE,
  guide = ggplot2::guide_colorsteps(even.steps = FALSE),
  position = "left",
  rescaler = scales::rescale,
  oob = scales::censor,
  super = ScaleDiscretised
)
Arguments
- scale_function
a scale function (e.g.
scale_fill_divergent)- ...
Arguments passed on to
continuous_scalescale_name![[Deprecated]](figures/lifecycle-deprecated.svg) The name of the scale
that should be used for error messages associated with this scale.
The name of the scale
that should be used for error messages associated with this scale.breaksOne of:
NULLfor no breakswaiver()for the default breaks computed by the transformation objectA numeric vector of positions
A function that takes the limits as input and returns breaks as output (e.g., a function returned by
scales::extended_breaks()). Note that for position scales, limits are provided after scale expansion. Also accepts rlang lambda function notation.
minor_breaksOne of:
NULLfor no minor breakswaiver()for the default breaks (none for discrete, one minor break between each major break for continuous)A numeric vector of positions
A function that given the limits returns a vector of minor breaks. Also accepts rlang lambda function notation. When the function has two arguments, it will be given the limits and major break positions.
n.breaksAn integer guiding the number of major breaks. The algorithm may choose a slightly different number to ensure nice break labels. Will only have an effect if
breaks = waiver(). UseNULLto use the default number of breaks given by the transformation.labelsOne of the options below. Please note that when
labelsis a vector, it is highly recommended to also set thebreaksargument as a vector to protect against unintended mismatches.NULLfor no labelswaiver()for the default labels computed by the transformation objectA character vector giving labels (must be same length as
breaks)An expression vector (must be the same length as breaks). See ?plotmath for details.
A function that takes the breaks as input and returns labels as output. Also accepts rlang lambda function notation.
limitsOne of:
NULLto use the default scale rangeA numeric vector of length two providing limits of the scale. Use
NAto refer to the existing minimum or maximumA function that accepts the existing (automatic) limits and returns new limits. Also accepts rlang lambda function notation. Note that setting limits on positional scales will remove data outside of the limits. If the purpose is to zoom, use the limit argument in the coordinate system (see
coord_cartesian()).
rescalerA function used to scale the input values to the range [0, 1]. This is always
scales::rescale(), except for diverging and n colour gradients (i.e.,scale_colour_gradient2(),scale_colour_gradientn()). Therescaleris ignored by position scales, which always usescales::rescale(). Also accepts rlang lambda function notation.oobOne of:
Function that handles limits outside of the scale limits (out of bounds). Also accepts rlang lambda function notation.
The default (
scales::censor()) replaces out of bounds values withNA.scales::squish()for squishing out of bounds values into range.scales::squish_infinite()for squishing infinite values into range.
trans- Deprecated in favour of
transform. callThe
callused to construct the scale for reporting messages.superThe super class to use for the constructed scale
- low, high
Colours for low and high ends of the gradient.
- space
colour space in which to calculate gradient. Must be "Lab" - other values are deprecated.
- na.value
Colour to use for missing values
- guide
Type of legend. Use
"colourbar"for continuous colour bar, or"legend"for discrete colour legend.- aesthetics
Character string or vector of character strings listing the name(s) of the aesthetic(s) that this scale works with. This can be useful, for example, to apply colour settings to the
colourandfillaesthetics at the same time, viaaesthetics = c("colour", "fill").- mid
colour for mid point
- midpoint
The midpoint (in data value) of the diverging scale. Defaults to 0.
- scale_name
- The name of the scale
that should be used for error messages associated with this scale.
- palette
A palette function that when called with a numeric vector with values between 0 and 1 returns the corresponding output values (e.g.,
scales::pal_area()).- name
The name of the scale. Used as the axis or legend title. If
waiver(), the default, the name of the scale is taken from the first mapping used for that aesthetic. IfNULL, the legend title will be omitted.- breaks
One of:
NULLfor no breakswaiver()for the default breaks computed by the transformation objectA numeric vector of positions
A function that takes the limits as input and returns breaks as output (e.g., a function returned by
scales::extended_breaks()). Note that for position scales, limits are provided after scale expansion. Also accepts rlang lambda function notation.
- labels
One of the options below. Please note that when
labelsis a vector, it is highly recommended to also set thebreaksargument as a vector to protect against unintended mismatches.NULLfor no labelswaiver()for the default labels computed by the transformation objectA character vector giving labels (must be same length as
breaks)An expression vector (must be the same length as breaks). See ?plotmath for details.
A function that takes the breaks as input and returns labels as output. Also accepts rlang lambda function notation.
- limits
One of:
NULLto use the default scale rangeA numeric vector of length two providing limits of the scale. Use
NAto refer to the existing minimum or maximumA function that accepts the existing (automatic) limits and returns new limits. Also accepts rlang lambda function notation. Note that setting limits on positional scales will remove data outside of the limits. If the purpose is to zoom, use the limit argument in the coordinate system (see
coord_cartesian()).
- trans
- Deprecated in favour of
transform. - drop
Should unused factor levels be omitted from the scale? The default, TRUE, uses the levels that appear in the data; FALSE uses all the levels in the factor.
- position
For position scales, The position of the axis.
leftorrightfor y axes,toporbottomfor x axes.- rescaler
A function used to scale the input values to the range [0, 1]. This is always
scales::rescale(), except for diverging and n colour gradients (i.e.,scale_colour_gradient2(),scale_colour_gradientn()). Therescaleris ignored by position scales, which always usescales::rescale(). Also accepts rlang lambda function notation.- oob
One of:
Function that handles limits outside of the scale limits (out of bounds). Also accepts rlang lambda function notation.
The default (
scales::censor()) replaces out of bounds values withNA.scales::squish()for squishing out of bounds values into range.scales::squish_infinite()for squishing infinite values into range.
- super
The super class to use for the constructed scale
Details
This scale makes it very easy to synchronise the breaks of filled contours
and the breaks shown no the colour guide. Bear in mind that when using
geom_contour_fill(), the default fill aesthetic (level_mid) is not
discretised. To use this scale with that geom, you need to set
aes(fill = after_stat(level)).
Examples
library(ggplot2)
scale_fill_brewer_discretised <- as.discretised_scale(scale_fill_distiller)
library(ggplot2)
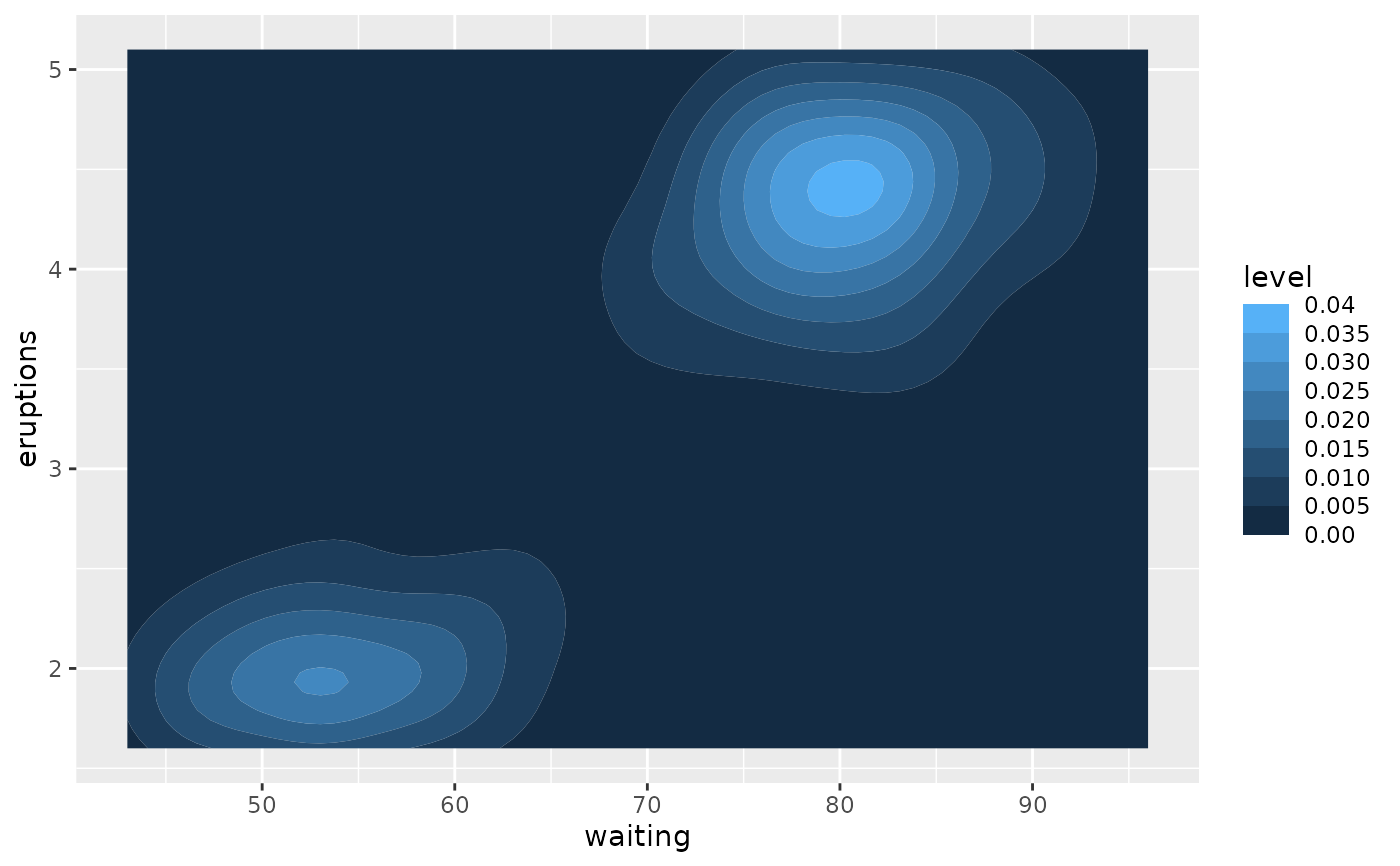
# Using the `level` compute aesthetic from `geom_contour_fill()`
# (or ggplot2::geom_contour_filled()), the default scale is discrete.
# This means that you cannot map colours to the underlying numbers.
v <- ggplot(faithfuld, aes(waiting, eruptions, z = density))
v + geom_contour_fill(aes(fill = after_stat(level)))
 v + geom_contour_fill(aes(fill = after_stat(level))) +
scale_fill_discretised()
v + geom_contour_fill(aes(fill = after_stat(level))) +
scale_fill_discretised()
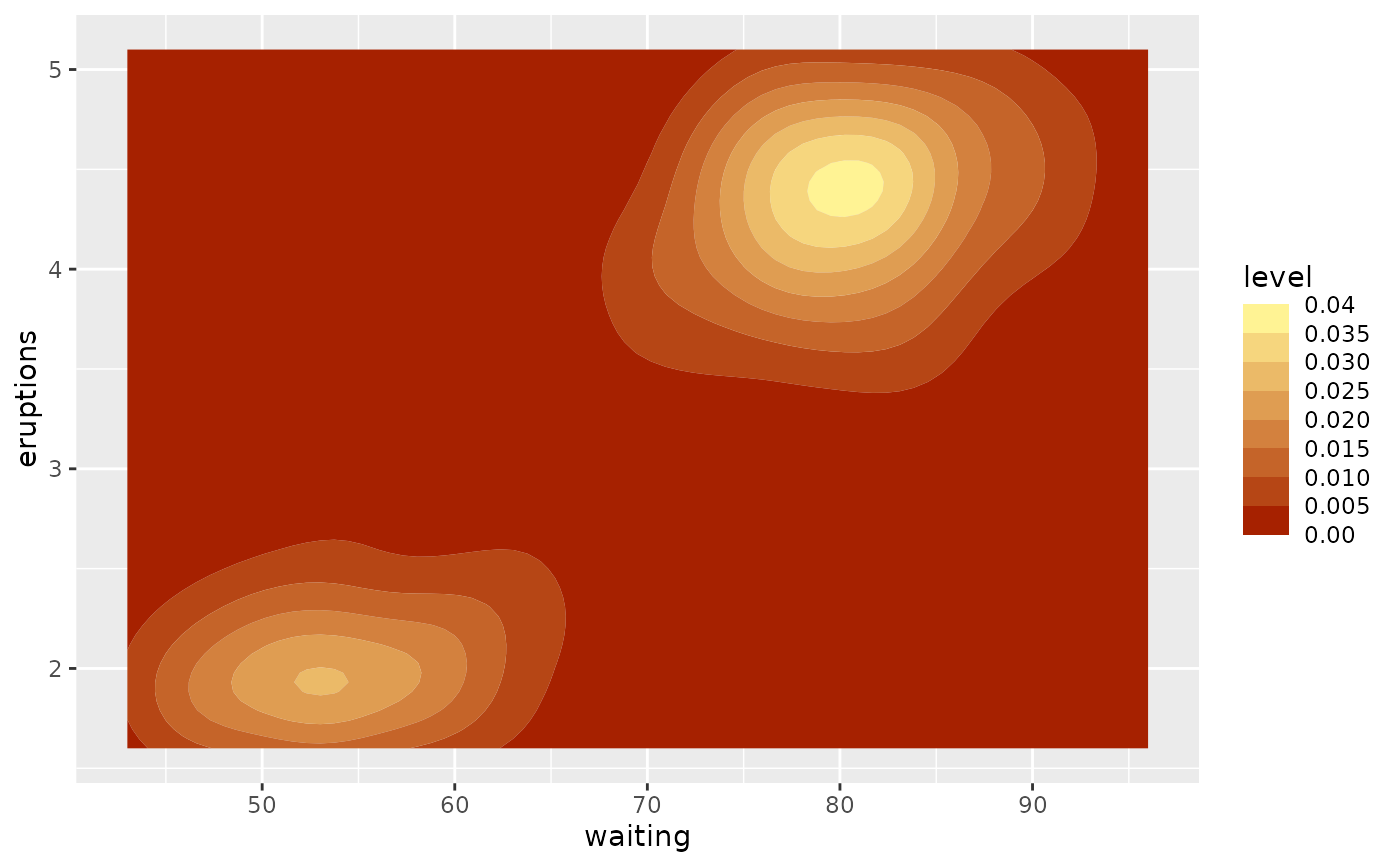
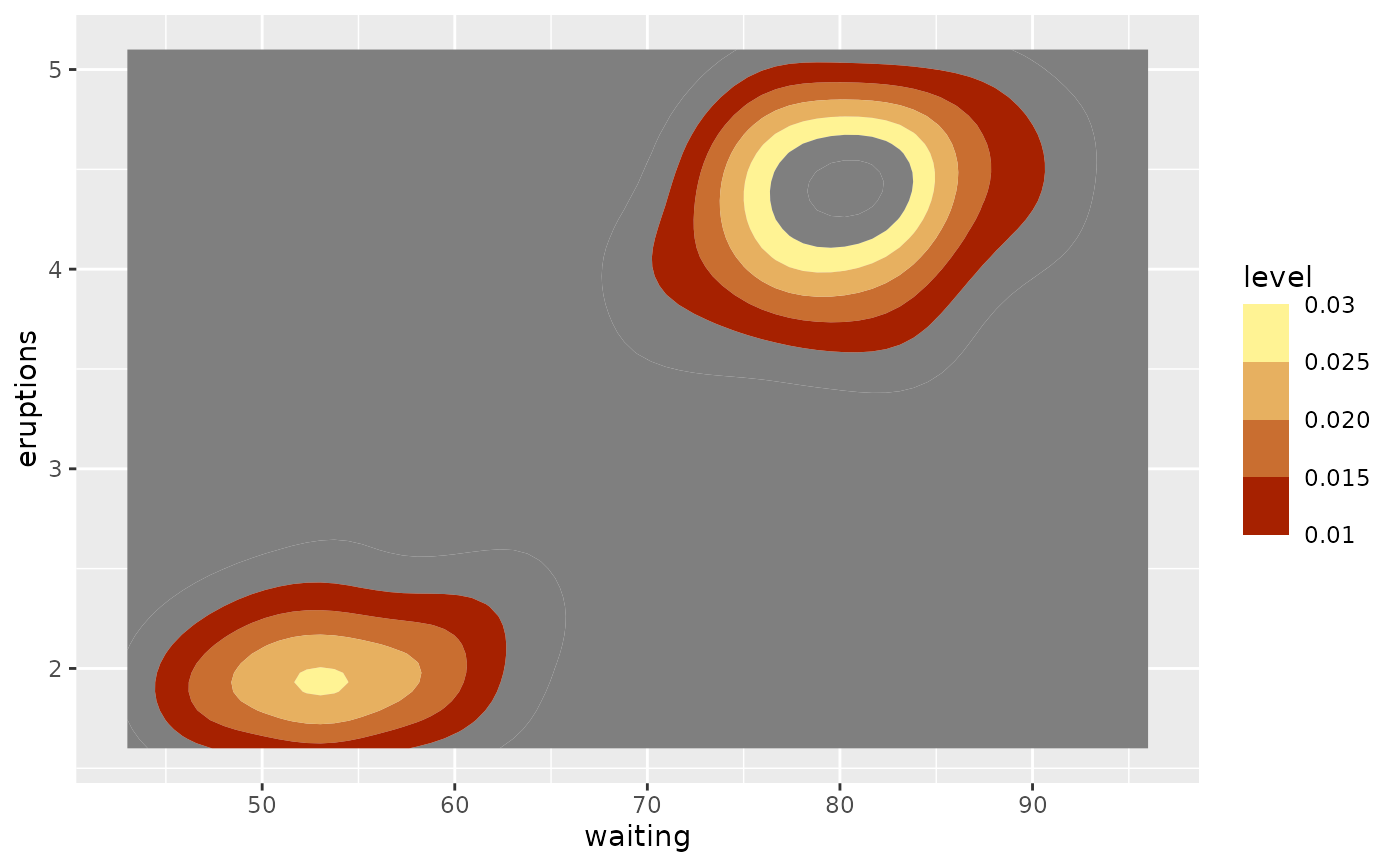
 # The scale can be customised the same as any continuous colour scale
v + geom_contour_fill(aes(fill = after_stat(level))) +
scale_fill_discretised(low = "#a62100", high = "#fff394")
# The scale can be customised the same as any continuous colour scale
v + geom_contour_fill(aes(fill = after_stat(level))) +
scale_fill_discretised(low = "#a62100", high = "#fff394")
 # Setting limits explicitly will truncate the scale
# (if any limit is inside the range of the breaks but doesn't
# coincide with any range, it will be rounded with a warning)
v + geom_contour_fill(aes(fill = after_stat(level))) +
scale_fill_discretised(low = "#a62100", high = "#fff394",
limits = c(0.01, 0.028))
#> Warning: User supplied limits don't correspond to valid breaks. [0.01, 0.028] rounded to [0.01, 0.03]
# Setting limits explicitly will truncate the scale
# (if any limit is inside the range of the breaks but doesn't
# coincide with any range, it will be rounded with a warning)
v + geom_contour_fill(aes(fill = after_stat(level))) +
scale_fill_discretised(low = "#a62100", high = "#fff394",
limits = c(0.01, 0.028))
#> Warning: User supplied limits don't correspond to valid breaks. [0.01, 0.028] rounded to [0.01, 0.03]
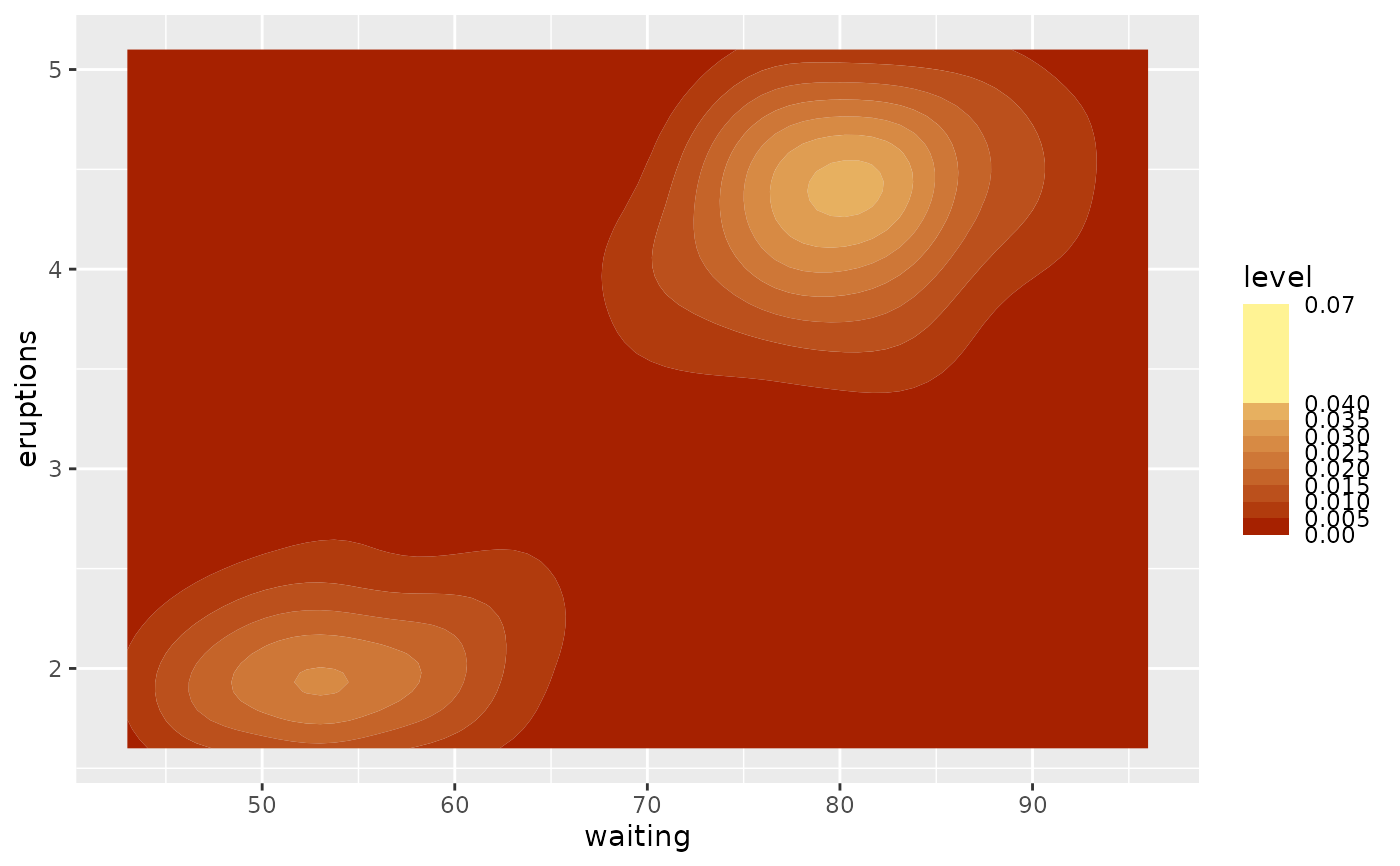
 # Or extend it.
v + geom_contour_fill(aes(fill = after_stat(level))) +
scale_fill_discretised(low = "#a62100", high = "#fff394",
limits = c(0, 0.07))
# Or extend it.
v + geom_contour_fill(aes(fill = after_stat(level))) +
scale_fill_discretised(low = "#a62100", high = "#fff394",
limits = c(0, 0.07))
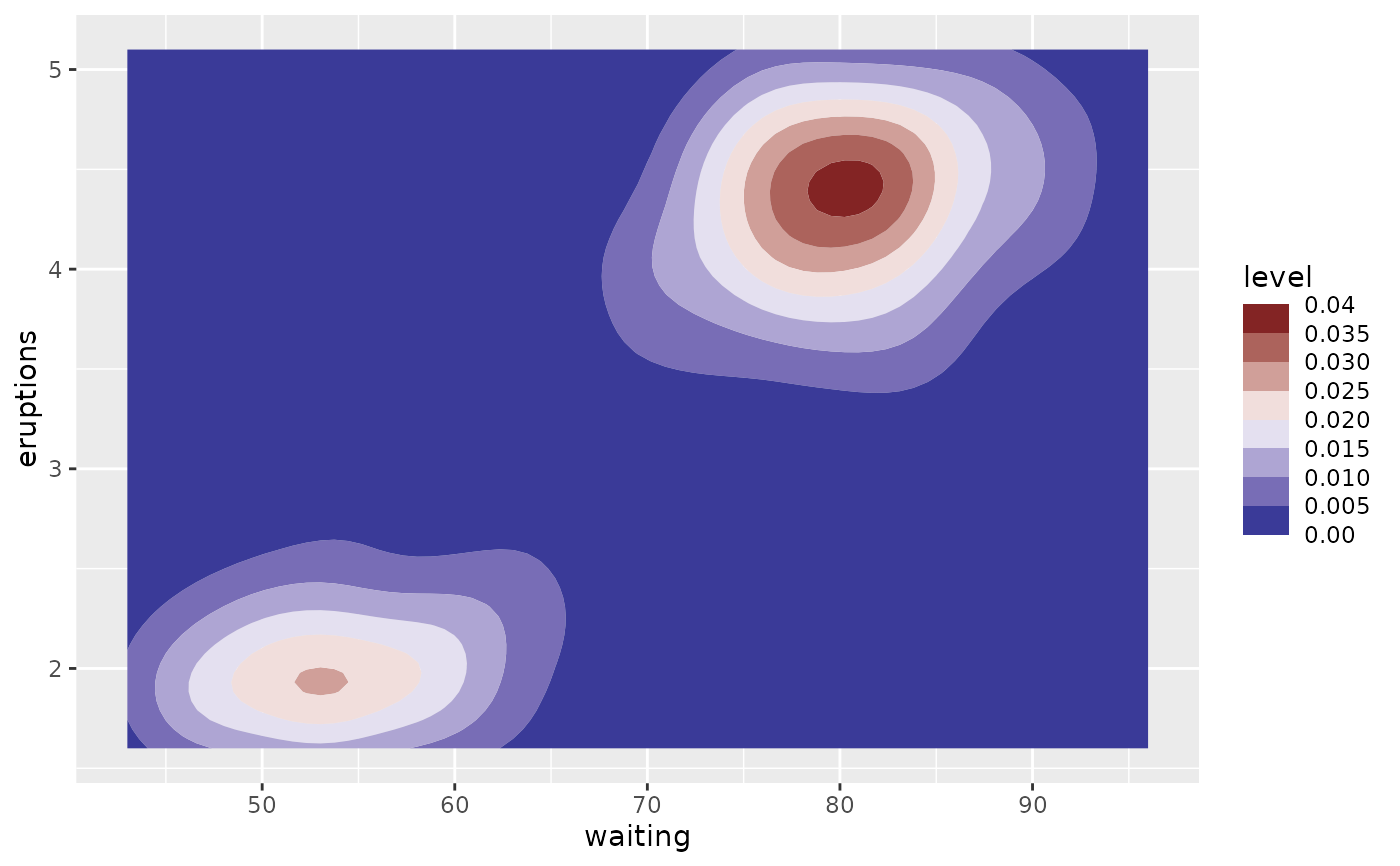
 v + geom_contour_fill(aes(fill = after_stat(level))) +
scale_fill_divergent_discretised(midpoint = 0.02)
v + geom_contour_fill(aes(fill = after_stat(level))) +
scale_fill_divergent_discretised(midpoint = 0.02)
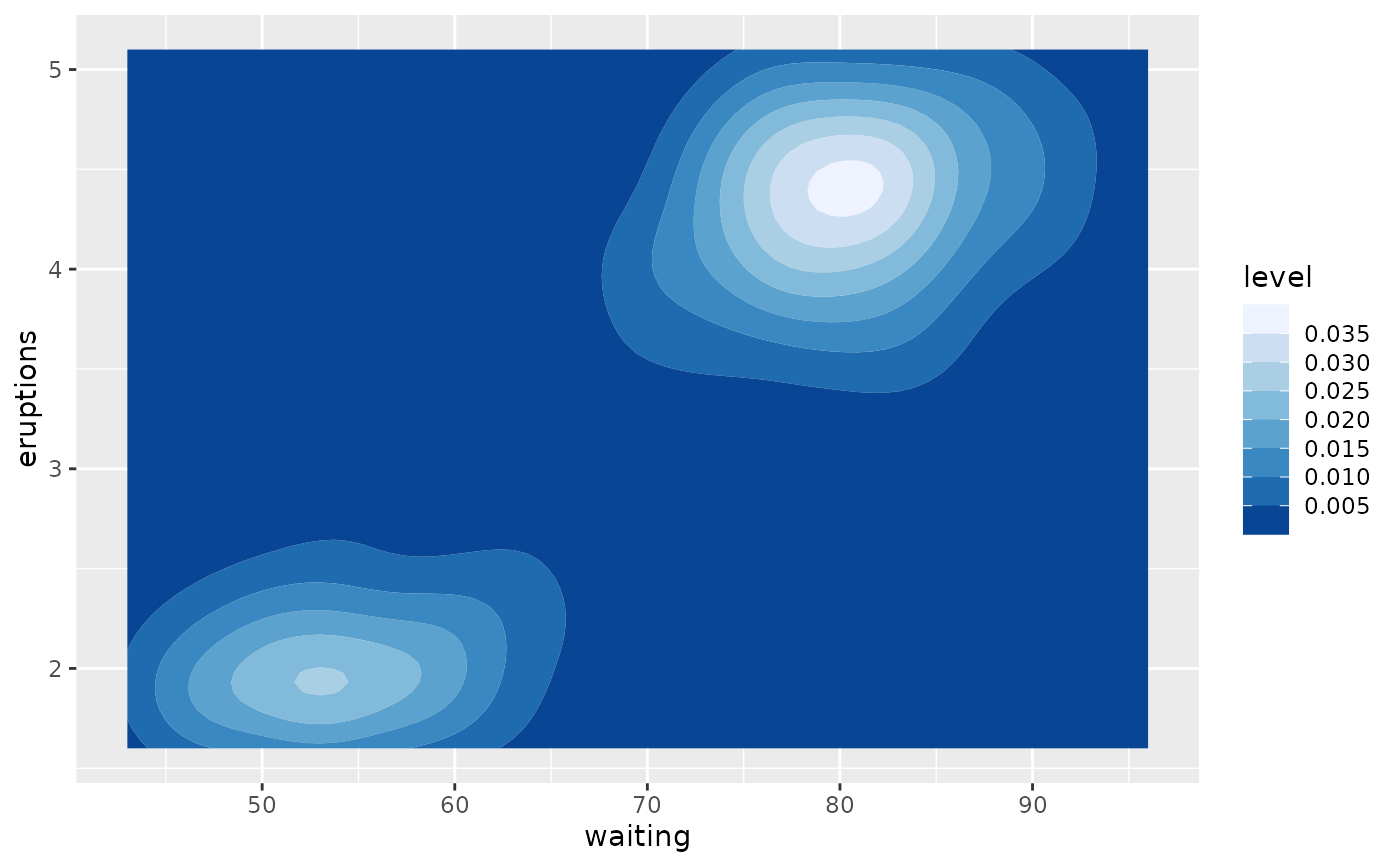
 # Existing continous scales can be "retrofitted" by changing the `super`
# and `guide` arguments.
v + geom_contour_fill(aes(fill = after_stat(level))) +
scale_fill_distiller(super = ScaleDiscretised)
# Existing continous scales can be "retrofitted" by changing the `super`
# and `guide` arguments.
v + geom_contour_fill(aes(fill = after_stat(level))) +
scale_fill_distiller(super = ScaleDiscretised)
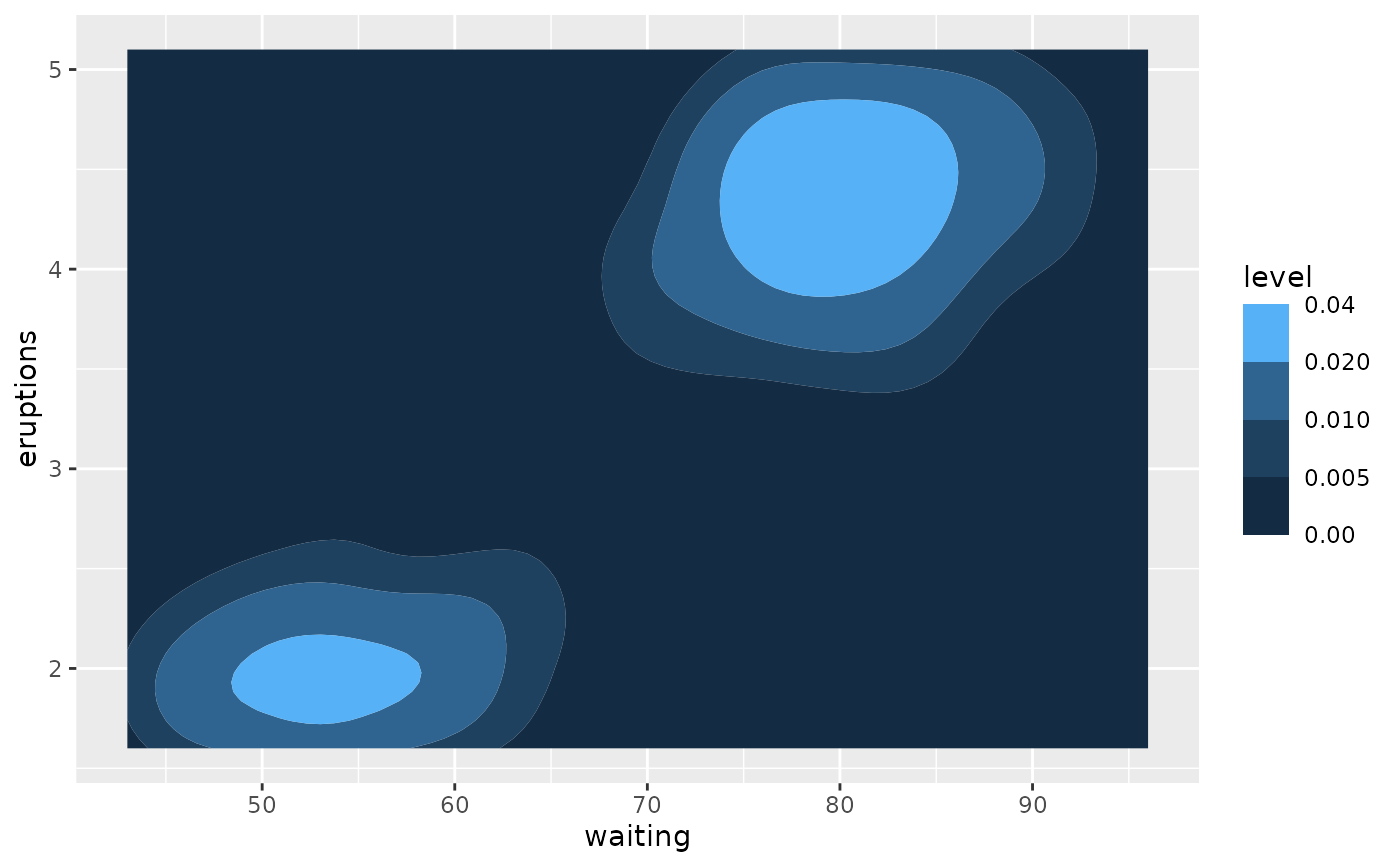
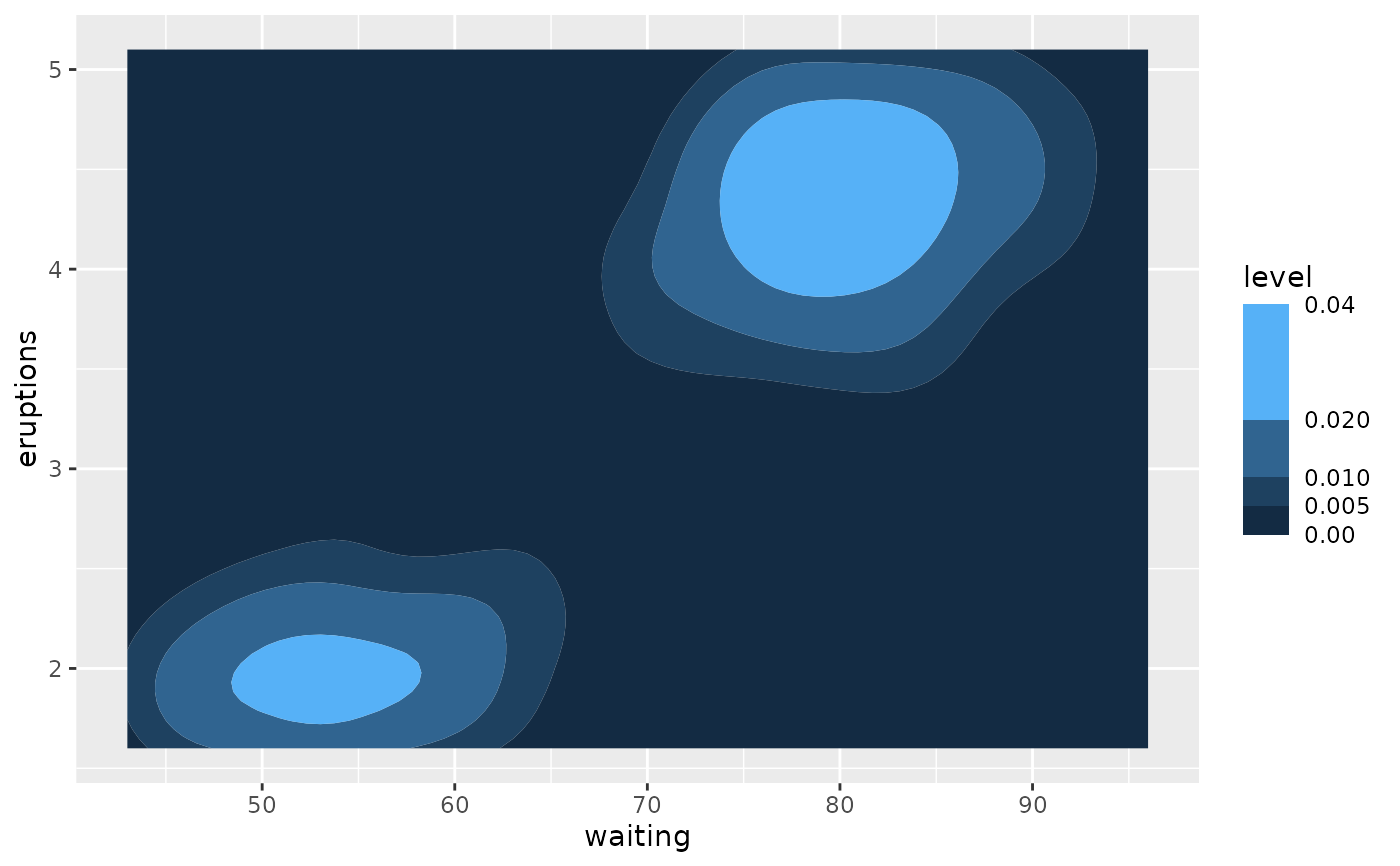
 # Unequal breaks will, by default, map to unequal spacing in the guide
v + geom_contour_fill(aes(fill = after_stat(level)), breaks = c(0, 0.005, 0.01, 0.02, 0.04)) +
scale_fill_discretised()
# Unequal breaks will, by default, map to unequal spacing in the guide
v + geom_contour_fill(aes(fill = after_stat(level)), breaks = c(0, 0.005, 0.01, 0.02, 0.04)) +
scale_fill_discretised()
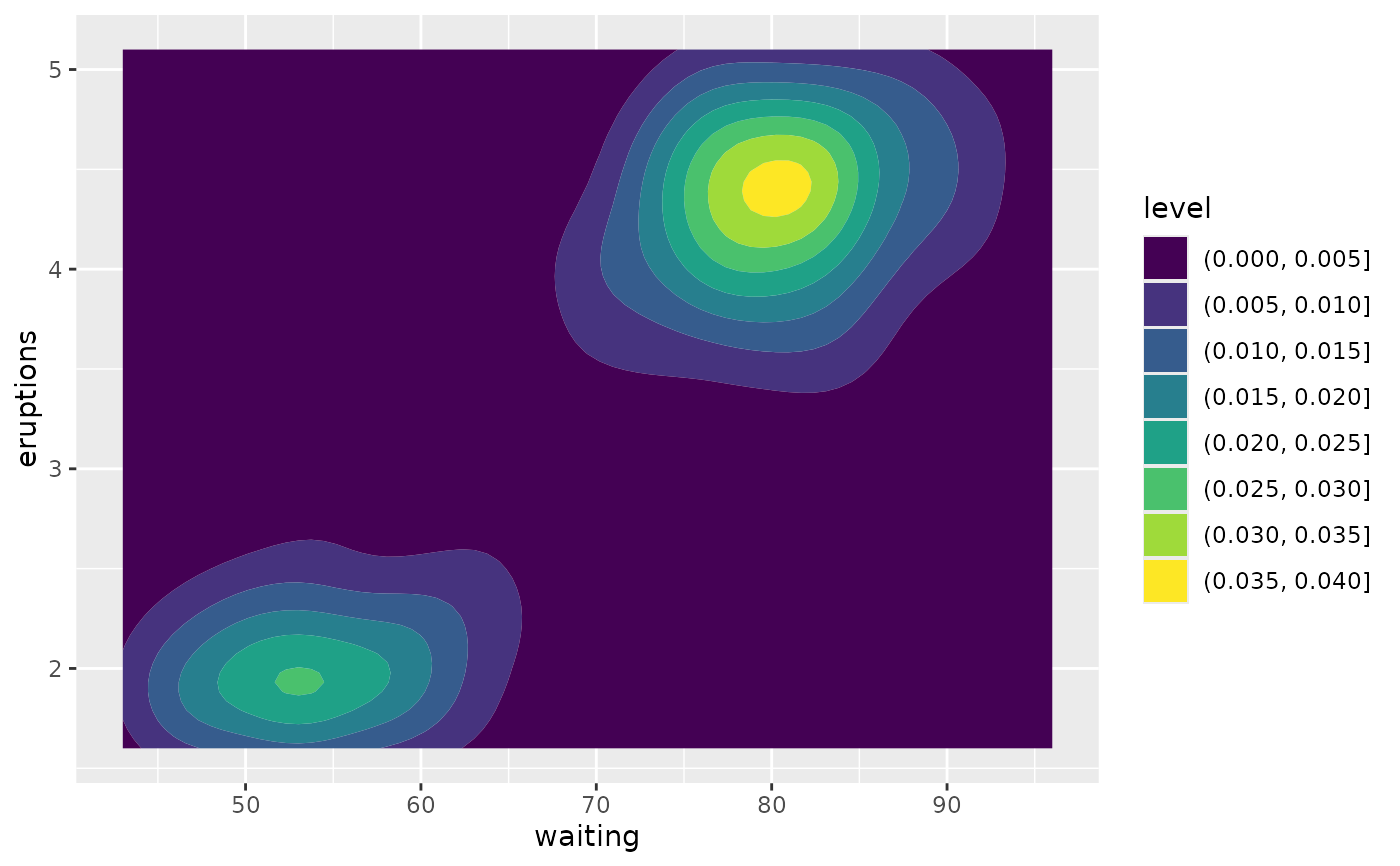
 # You can change that by the `even.steps` argument on ggplot2::guide_colorsteps()
v + geom_contour_fill(aes(fill = after_stat(level)), breaks = c(0, 0.005, 0.01, 0.02, 0.04)) +
scale_fill_discretised(guide = guide_colorsteps(even.steps = TRUE, show.limits = TRUE))
# You can change that by the `even.steps` argument on ggplot2::guide_colorsteps()
v + geom_contour_fill(aes(fill = after_stat(level)), breaks = c(0, 0.005, 0.01, 0.02, 0.04)) +
scale_fill_discretised(guide = guide_colorsteps(even.steps = TRUE, show.limits = TRUE))